Implementing a brainfuck CPU in Ghidra - part 2: Decompilation of pointer and arithmetic instructions
- Setup and disassembly
- Decompilation of pointer and arithmetic instructions (current post)
- Decompilation of I/O and control flow instructions
- Renaming the analyzer and adding a manual
- Recognizing common patterns (future post)
More posts may be added to this series in the future.
In the previous post we created a processor module for a compiled version of brainfuck. Right now, it can only disassemble brainfuck binaries, but not decompile them. In this post we’ll take a look at the decompilation part of the processor module. More specifically, we’ll implement the pointer (> and <) and arithmetic (+ and -) instructions. We’ll handle the other instructions later.
Auto analysis
Before we get to writing semantics for the instructions, let’s first address a problem from the previous post: the auto analysis does not disassemble the binary.
When a binary is opened with the code browser, Ghidra asks if it should perform auto analysis on the binary. Upon clicking yes the analysis options menu opens, showing all the available analyzers for this binary. Among these is the Disassemble Entry Points analyzer:
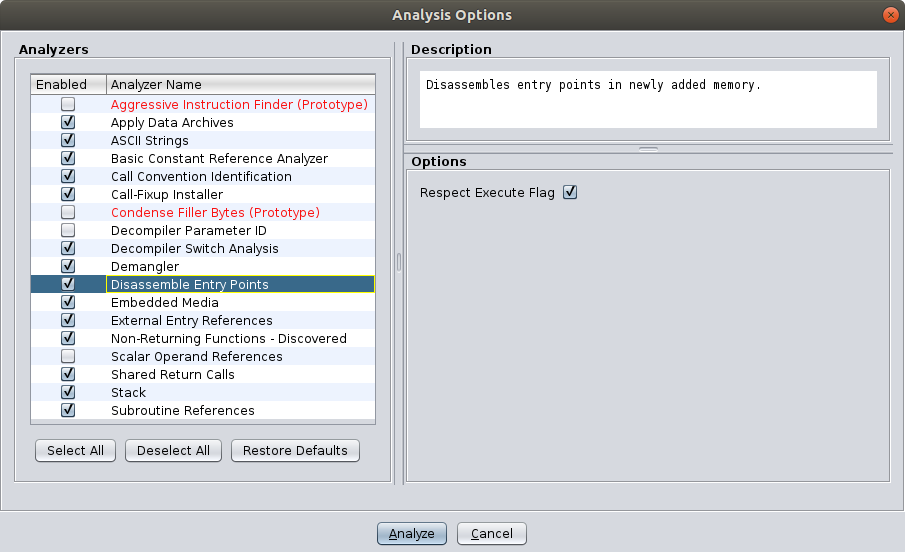
The purpose of this analyzer is disassembling code at the entry points of the binary. If we mark address 0x0000 as an entry point, this analyzer should automatically disassemble it when we perform the auto analysis. Marking entry points is very simple, though there is no documentation on it. Add the following code to the <processor_spec> tag in brainfuck.pspec:
<default_symbols>
    <symbol name="start" address="rom:0x0000" type="code" entry="true"/>
</default_symbols>
This creates a symbol start (you can rename it) at address 0x0000 and marks it as entry point. If we now delete mul2.bin from Ghidra, reimport it1 and run the auto analysis, the binary will be decompiled automatically. The stack analyzer throws an error, because there is no stack. This is safe to ignore. (Optionally, this analyzer can be disabled in the analysis options menu.)
Pointer instructions
The semantics of the pointer instructions (> and <) are the simplest to implement. Let’s implement the semantics of > first. The semantics of < can be implemented very similarly.
The > instruction adds 1 to the ptr register. This can be represented using the SLEIGH operator +2:
:> is op=0x0 {
    ptr = ptr + 1;
}
The semantics for < are almost identical, except that the + is now a -:
:< is op=0x1 {
    ptr = ptr - 1;
}
Arithmetic instructions
The arithmetic instructions (+ and -) are slightly more complex than the pointer instructions. They do not operate on a register, but on memory (ram) pointed to by the ptr register. The arithmetic instructions can be broken up into three operations:
- Load the value of the current cell from
raminto a temporary variable (let’s name itcfor cell). In SLEIGH this looks like:local c:2 = *[ram]ptr; - Increment or decrement the cell value by one:
c = c + 1orc = c - 1 - Store the new value in the current cell:
*[ram]ptr = c;
Thus, we have:
:+ is op=0x2 {
    local c:2 = *[ram]ptr;
    c = c + 1;
    *[ram]ptr = c;
}

:- is op=0x3 {
    local c:2 = *[ram]ptr;
    c = c - 1;
    *[ram]ptr = c;
}
P-code and varnodes
This section covers the internal representation of instruction semantics in Ghidra. It isn’t strictly necessary to understand this in order to create a processor module, so you may skip it. I do advise you to read it though, as it can be very useful to have some knowledge of the underlying representation that Ghidra uses.
As described in the previous post, Ghidra doesn’t use the .slaspec directly. Instead it uses the .sla file, which is compiled from the .slaspec file by the SLEIGH compiler3. The .slaspec is readable and human-friendly, while the .sla is very verbose and more machine-friendly. Similarly, Ghidra doesn’t use SLEIGH operators and symbols directly to describe instructions, but p-code operations and varnodes.
While the SLEIGH operators have a C-like syntax, p-code operations have an assembly-like syntax. Consider the following SLEIGH semantics, for example:
local x:2;
x = 36;
x = x + 44;
This may be translated to the following p-code4:
$U10:2 = COPY 36:2
$U10:2 = INT_ADD $U10, 44:2
The SLEIGH compiler has created a varnode in the unique address space for the temporary symbol x in the SLEIGH semantics. This varnode starts at address 0x10, has a size of 2 bytes and is denoted by $U10 or $U10:2.
The first operation, COPY, copies the value 36 into $U10. The second operation, INT_ADD, adds 44 to $U10 and stores the result in $U10.
Now that we know more about the translation from SLEIGH semantics to p-code, let’s view the generated p-code for our implemented SLEIGH semantics.
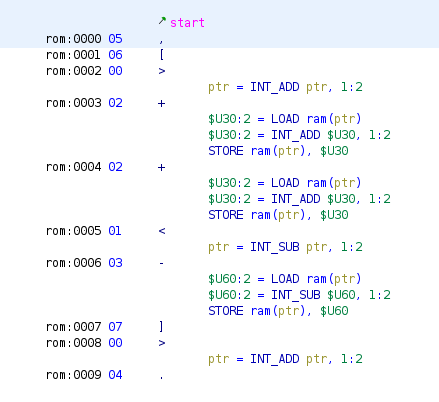
If we open mul2.bin in the code browser, we can view the p-code of the >, <, + and - instructions by enabling the p-code field in the listing. First, click the Edit the Listing fields button in the top right corner of the listing. The icon looks like a wall above an arrow:

A menu should open now. Click the Instruction/Data tab:
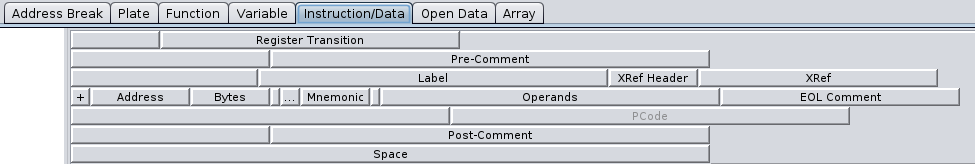
Right-click the PCode field and enable it. The listing now shows the p-code for every instruction that has p-code associated with it:
You may also enable the more verbose raw p-code. To do this go to Edit → Tool Options..., then Listing Fields → Pcode Field and enable the Display Raw Pcode option. The raw p-code for the + looks like this:
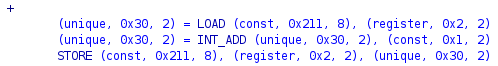
You’ll rarely need to look at (raw) p-code during disassembly and decompilation of real-world programs. Still, it can be useful to have this field enabled during the development of a processor module, when emulating code or developing abstract analyzers. In most other cases you needn’t worry about these low-level details.
Decompilation
Ghidra should now be able to decompile any brainfuck programs that use (only) the >, <, + and - instructions. Here is such a program, mark_uneven.bf:
>+>
>+>
>+>
This program increments the first three cells that have an uneven address. It’s not particularly useful, but it only uses instructions that we have described the semantics of.
We can compile it (./bfc.py mark_uneven.bf mark_uneven.bin) and load it into Ghidra. Thanks to the entry point definition in the .pspec, Ghidra creates a function called start at 0x0000 and disassembles it. When we click the function, the decompile window should show a decompilation. Unfortunately this is not what happens. What happens is that the decompiler shows an error:

This is because of the following bug: the decompiler refers to the stack5, but we haven’t specified one, because there is no stack in brainfuck6. This causes the decompiler to crash. To work around this, we can create a dummy register and address space in the .slaspec:
define space dummy_space type=ram_space size=2 wordsize=2;
...
define register offset=0x00 size=2 [pc ptr dummy_reg];
We’ll use dummy_space and dummy_reg anytime a register or address space is required that doesn’t exist in the brainfuck architecture. The stack pointer can be defined by adding the following code to the <compiler_spec> tag in the .cspec:
<stackpointer register="dummy_reg" space="dummy_space" growth="negative"/>
We’re not done yet (but almost, so don’t worry!). If we’d run the decompiler now, it would - again - show an error:
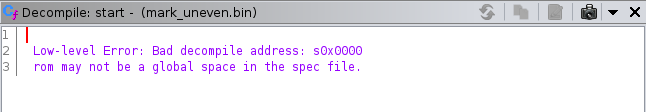
This error is more descriptive than the previous one: the decompiler won’t decompile instructions at address 0x0000, because the memory hasn’t been marked as global. Any memory not marked as global is assumed to be temporary. Hence, it is important that we mark rom and ram as global. Add the following code to the <compiler_spec> tag in the .cspec:
<global>
    <range space="rom"/>
    <range space="ram"/>
</global>
While we’re at it, we can also add ram memory to the .pspec so that it shows up in the program tree. (rom is already shown in the program tree, because it is the default address space.) Add this to the <processor_spec> tag in the .pspec:
<default_memory_blocks>
    <memory_block name="ram" start_address="ram:0x0000" length="0x1000" mode="rw"/>
</default_memory_blocks>
Now, the decompiler is able to decompile the binary:
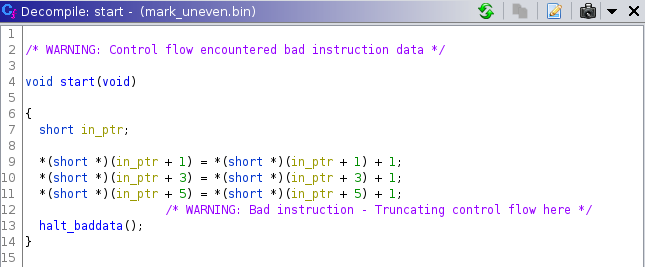
It shows two warnings, because the function unexpectedly terminates, instead of returning, endlessly looping or calling to a non-returning function (e.g. exit). These warnings can be safely ignored.
Cleaning up decompilation
The current decompilation doesn’t look very good, but we can improve it. The increments are represented in the decompilation by:
*(short *)(in_ptr + x) = *(short *)(in_ptr + x) + 1
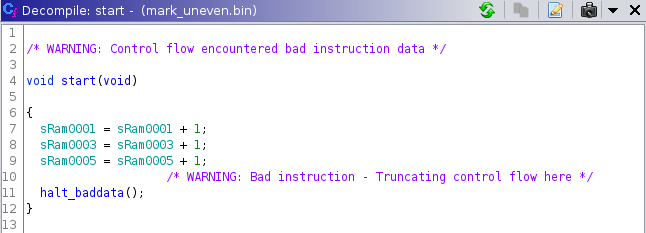
This can be drastically improved by assigning an initial value to the ptr register. This value is called an assumption. Press ctrl + R on the start of the function and set the value of ptr (16) to 0. The decompilation looks a lot better now:
Instead of setting the ptr value to 0 for every brainfuck binary we want to disassemble, we can also add some code to <processor_spec> in the <processor_spec> tag of the .pspec (or .cspec, which also accepts the <context_data> tag):
<context_data>
    <tracked_set space="rom" first="0x0000" last="0x0000">
        <set name="ptr" val="0"/>
    </tracked_set>
</context_data>
This code lets Ghidra assume that the value of ptr equals 0 at the function starting at address 0x0000, also known as the entry point in this case.
If we now reimport the binary, ptr is automatically assumed to be 0 at address 0x0000.
The final step in cleaning up the decompilation is marking the first three uneven addresses as data (uint16_t or ushort) and naming them. This results in the following readable decompilation:
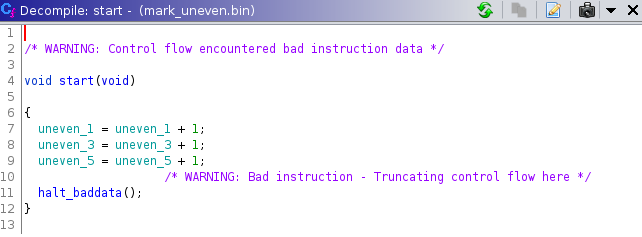
An even better decompilation would be the following:
void start(void){
    uneven_1 = 1;
    uneven_3 = 1;
    uneven_5 = 1;
}
This would require Ghidra to assume that ram is zero at address 0x0000. I don’t think this is possible. (I hope Cunningham’s Law holds in this case and someone proves me wrong.)
That’s it for this post. We’ve implemented decompilation of the pointer and arithmetic instructions and cleaned up the decompilation. We’ve also taken a quick look at Ghidra’s internal representation of instruction semantics (p-code). In the next post, we’ll complete the semantics for the brainfuck instruction set by writing code for the I/O (. and ,) and control flow ([ and ]) instructions. See you then!
You can find the final code for this post here.
Footnotes
-
From now on it is assumed that you reimport binaries everytime a change is made to the
.ldefs,.pspec,.cspecand in some cases even the.slaspec. ↩ -
Refer to SLEIGH - 7.7. The Semantic Section for information on the semantics section of constructors. ↩
-
This compilation is done automatically by Ghidra when it encounters a
.slaspec, so there is no need for us to compile it. ↩ -
See the P-Code Reference Manual and SLEIGH - 9. P-code Tables, both part of the Ghidra Language Specification. ↩
-
The decompiler dereferences pointers to the stack space in a lot of places. For example,
coreaction.cc:1644calls a functiongatherwith a pointer to the stack space. Since there is no stack space defined, this pointer isNULL.gatherdereferences the pointer atvarmap.cc:542. The dereference of thisNULLpointer will result in a segmentation fault: The decompiler dies. ↩ -
It could be argued whether this is really a bug, as virtually every architecture uses a stack. ↩