Implementing a brainfuck CPU in Ghidra - part 3: Decompilation of I/O and control flow instructions
- Setup and disassembly
- Decompilation of pointer and arithmetic instructions
- Decompilation of I/O and control flow instructions (current post)
- Renaming the analyzer and adding a manual
- Recognizing common patterns (future post)
More posts may be added to this series in the future.
This is already the third post in this series. This time we’ll complete the decompilation part of the processor module by adding semantics for the I/O (. and ,) and control flow ([ and ]) instructions.
I/O instructions
The . (output) and , (input) instructions can’t be described by regular p-code operations, as regular p-code operations operate only on varnodes. They don’t allow for modelling external input. Luckily, we can define custom p-code operations like this:
define pcodeop in;
define pcodeop out;
This code declares two custom p-code operations: in and out. User-defined p-code operations can have any number of input varnodes and an additional output varnode. Ghidra will not (and cannot) make any assumptions about these operations; they are treated as black boxes. Because Ghidra can’t analyze these black boxes, you should always try to keep the number of user-defined p-code operations to a minimum.
in and out can be used in SLEIGH semantic statements using using functional syntax (calling them like a function, e.g. f(x)). The following statements are all valid (assuming x, a, b and c are defined):
x = in();
x = in(a);
in(a, b, c);
x = out()
x = out(a, b)
It is even valid to call an operation with one operand first and later with two:
out(a);
...
out(a, b);
Most of these don’t make sense. Only x = in() and out(x) make sense. in should not take any input and outputs one value. out is the opposite: it takes exactly one input and does not return anything. There is no way to enforce this using the specification. It is the task of the language creator to do this.
Something like this is not allowed:
x, y = in()
This is because p-code operations can have at most one output varnode.
Let’s see how we can use our newly defined p-code operations to define the semantics of the . instruction and later of the , instruction. The . instruction does the following: it takes the value of the current cell and outputs this value.
:. is op=0x4 {
    local c:2 = *[ram]ptr;
    out(c);
}
You can also write out(*[ram]:2 ptr);, if you’re feeling brave. In my opinion, this reduces readability.
The , instruction takes input and stores it in the current cell:
:, is op=0x5
{
    local c:2 = in();
    *[ram]ptr = c;
}
(Or write *[ram]:2 ptr = in();.)
We can test these instructions using a simple program called add3.bf. It takes user input, adds three to it and outputs the result:
,      store user input
+++    add three
.      output
Compile it (./bfc.py add3.bf add3.bin) and open it in Ghidra. The disassembly will look like this:
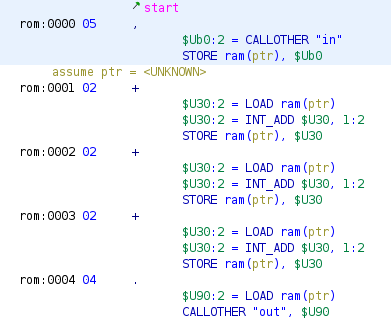
Here it can be seen that user-defined p-code operations in SLEIGH are converted to CALLOTHER operations in the p-code. These CALLOTHER operations take the user-defined operation name as their first argument, followed by the arguments of that operation. More concretely, an operation like out(c) gets converted to:
CALLOTHER "out", $U90
Where $U90 is the varnode in the unique address space corresponding to the symbol c.
In the decompilation, these user-defined p-code operations are represented by functions:
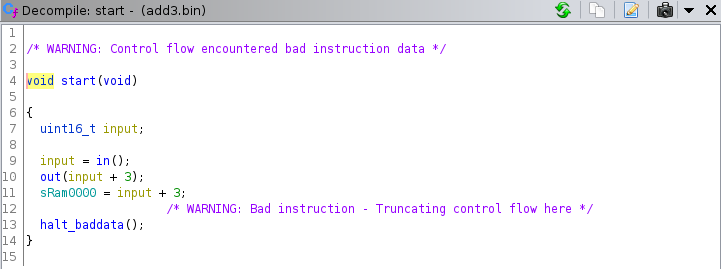
An interesting thing about this decompilation is that the order of execution is not preserved. In the decompilation, out is called before the value is written to memory. An order-preserving decompilation may look like this:
sRam0000 = in();
sRam0000 += 3;
out(sRam0000);
The decompiler is free to move statements around as long as it can prove the outcome is the same. In this case, the output is preserved: in both cases the result of in() + 3 is written out using out and written to ram at address 0x0000.
Control flow instructions
Implementing the I/O instructions was the easy part. The implementation of the control flow instructions is a bit more complex, because of the unusual branch implementation of brainfuck. Common architectures have branch instructions that encode an absolute or relative address for the CPU to branch to. Brainfuck doesn’t encode the branch destination in the instruction itself. Instead if it encounters [, it may jump to the corresponding ], depending on the current cell value. If it encounters a ], it jumps to the corresponding [. Compare the following brainfuck code to its (unoptimized) ARM (ARMv6-M Thumb) equivalent (r0 is ptr and r1 is a temporary register to hold the current cell value):
+-[-]+
; +
ldr r1, [r0]
add r1, #1
str r1, [r0]

; -
ldr r1, [r0]
sub r1, #1
str r1, [r0]

loop_start:
; [
ldr r1, [r0]
cmp r1, #0
beq loop_end

; -
ldr r1, [r0]
sub r1, #1
str r1, [r0]

; ]
b loop_start
loop_end:

; +
ldr r1, [r0]
add r1, #1
str r1, [r0]
The ARM assembly may look complicated, but it produces a nice decompilation1:
void FUN_00010000(void){
    int *ptr;

    (*ptr)++;
    (*ptr)--;
    while (*ptr != 0)
        (*ptr)--;

    *ptr = 1;

    halt_baddata();
}
The b instruction looks like this in p-code:
BRANCH *[ram]0x10006:4
The beq instruction looks as follows:
$Uefa0:1 = INT_NOTEQUAL ZR, 0:1
CBRANCH *[ram]0x10012:4, $Uefa0
The p-code for these ARM instructions is very short because they have an almost one-to-one correspondence with their p-code operations. The control flow graph of the program looks like this:
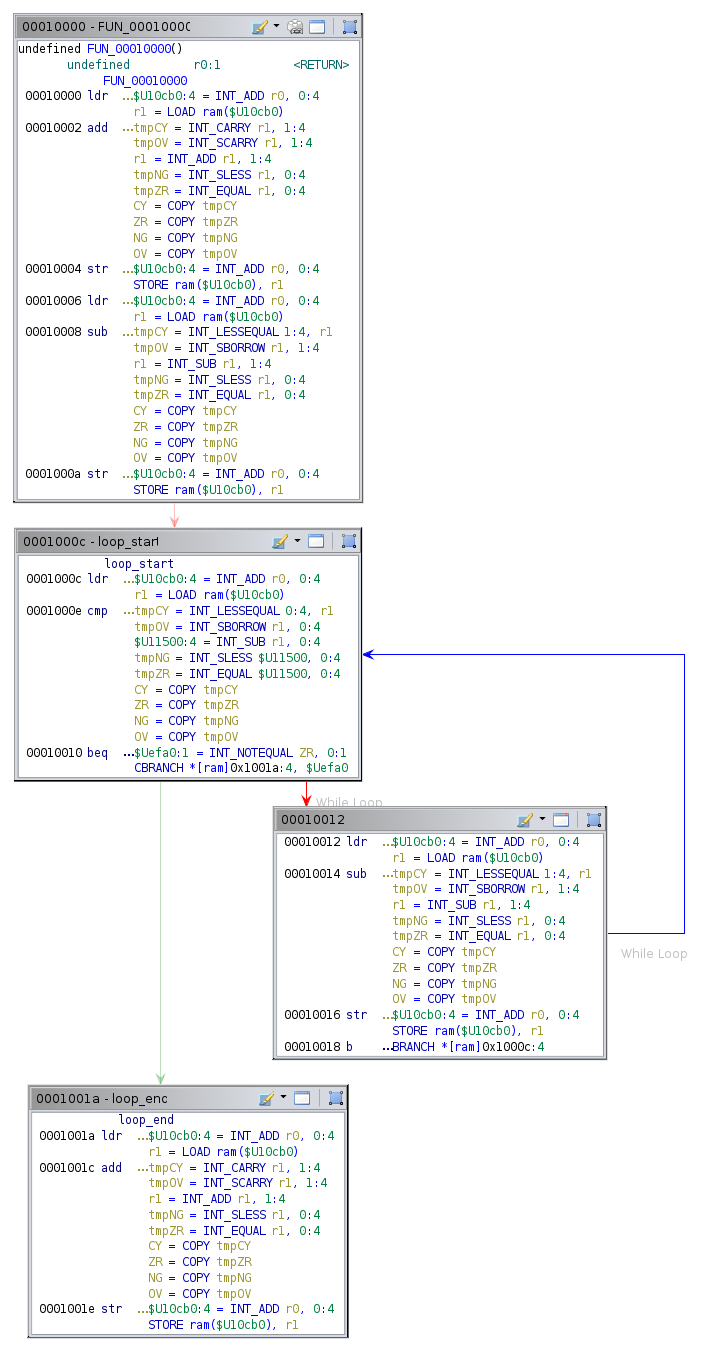
Ghidra can easily calculate the branch destinations and then recover the loop-structure of this program. It is of great importance that Ghidra can compute the branch destination. If not, it can’t recover the structure of the program.
The brainfuck variant of the program looks a lot simpler, but its p-code is more complicated. Let’s model the semantics of the [ instruction. We’ll restrict ourselves to the context of this program, which means that (a) there are just two control flow instructions in the entire program (one [ and one ]) and (b) the cell value at the [ instruction is zero, so the cpu should always branch to the corresponding ] instruction.
The following code searches for the next ] (opcode 0x7) and branches to it:
:[ is op=0x6 {
    local addr:2 = inst_start + 1;

    <check>
    local instr:2 = *addr;
    if(instr == 0x7) goto <end>;
    addr = addr + 1;
    goto <check>;

    <end>
    goto [addr];
}
This produces the following decompilation for control_flow_test.bf:
void start(void){
    short *UNRECOVERED_JUMPTABLE;

    /* WARNING: Could not recover jumptable at 0x0002. Too many branches */
    /* WARNING: Treating indirect jump as call */
    UNRECOVERED_JUMPTABLE = (short *)0x3;
    while (*UNRECOVERED_JUMPTABLE != 7)
        UNRECOVERED_JUMPTABLE = (short *)((short)UNRECOVERED_JUMPTABLE + 1);

    (*(code *)UNRECOVERED_JUMPTABLE)();
    return;
}
The control flow graph of this program consists of just one block, ending with a BRANCHIND to an unknown destination:
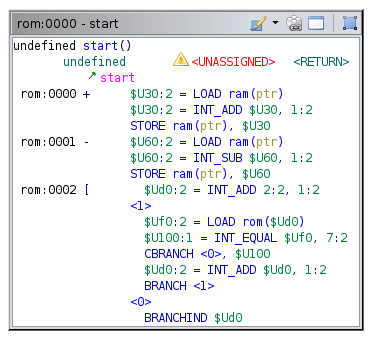
Clearly, Ghidra is unable to statically calculate the branch destination of the [ instruction, even though it is statically computable2. Simper calculations in the semantics (with control flow constructs , but without loops) are computed correctly by Ghidra. My guess is Ghidra doesn’t bother computing loops in p-code, although I have not really looked into this (yet). (If there is a way to compute this statically in SLEIGH semantics, please contact me!)
It’s no use continuing to implement the semantics of [ and ] this way. We need another way to statically compute branch destinations that Ghidra does understand. I came up with the following:
- Compute the branch destinations using an analyzer, written in Java
- Write these destinations to memory that’s marked as read-only
- The instruction semantics for the control flow instructions will consist of a check whether the cpu should branch, a load from memory and a branch to the loaded destination.
We’ll call this memory that holds branch destinations bdest. This memory can be created by adding the following to the <default_memory_blocks> tag in the .pspec:
<memory_block name="bdest" start_address="bdest:0x0000" length="0x1000" mode="r" initialized="true"/>
Expose bdest to SLEIGH by extending the address space definitions in the .slaspec:
define space bdest type=ram_space size=2 wordsize=2;
The last thing to do is to mark bdest as read-only in the .cspec. Add this to the <compiler_spec> tag:
<readonly>
    <range space="bdest" first="0x0000" last="0x0fff"/>
</readonly>
Without this, the decompiler doesn’t assume that bdest is read-only, even though
it is marked as such in the .pspec (mode="r").
Eclipse automatically created an analyzer for us when we selected analyzer in the project wizard during the project setup. It is called BrainfuckAnalyzer.java. The functions getDefaultEnablement and registerOptions can be removed, because this analyzer won’t use them. Change the constructor to this:
private final static String NAME = "Brainfuck Branch Destination Resolver";
private final static String DESCRIPTION = "Computes branch destinations for control flow instructions ([ and ]) and writes them to bdest memory";
...
public BrainfuckAnalyzer() {
    super(NAME, DESCRIPTION, AnalyzerType.BYTE_ANALYZER);
    setDefaultEnablement(true);
    setSupportsOneTimeAnalysis(true);
    setPriority(AnalysisPriority.DISASSEMBLY.before());
}
The analyzer is marked as byte analyzer instead of instruction analyzer, because it operates on raw bytes before they are converted to instructions so that Ghidra can correctly analyze branches. Read more about analyzer types in the source code.
The next statements notify Ghidra that the analyzer should be enabled by default and that it supports one time (one-shot) analysis. One time analysis does not mean it can only be called once, but that it can be called at any time and not just during auto analysis. It is obvious that the analyzer should be called before disassembly. Hence the priority DISASSEMBLY.before().
There are two functions left: canAnalyze and added. We’ll get to canAnalyze first. This function tells Ghidra whether the analyzer can analyze the program. This analyzer should only analyze Brainfuck programs:
private final static String PROCESSOR_NAME = "brainfuck";
...
@Override
public boolean canAnalyze(Program program) {
    String procName = program.getLanguage().getProcessor().toString();
    return procName.equals(PROCESSOR_NAME);
}
added is where the real magic happens. This function is called when bytes are added to the program or during auto or one-shot analysis. It’s responsible for the analysis. We’ll put the main logic in a function called resolveBranchDests and call that function from added, which catches and reports exceptions.
@Override
public boolean added(Program program, AddressSetView set, TaskMonitor monitor, MessageLog log)
        throws CancelledException {
    try {
        return resolveBranchDests(program, monitor);
    } catch(CancelledException e) {
        throw e;
    } catch(Exception e) {
        log.appendException(e);
        return false;
    }
}
This constructions throws CancelledException (raised by monitor.checkCanceled() when the user cancels the operation) and logs any other exceptions.
Let’s write resolveBranchDests. This function receives a Program and a TaskMonitor and it can throw a CancelledException and a MemoryAccessException. The latter will be raised if the memory we’re trying to write (bdest) is uninitialized. It will not be thrown because we set initialized="true" in the .pspec. It is a checked exception, however, so we must catch it.
private boolean resolveLoops(Program program, AddressSetView set, TaskMonitor monitor, MessageLog log)
        throws CancelledException, MemoryAccessException {
    Memory mem = program.getMemory();
    MemoryBlock rom = mem.getBlock("rom");
    MemoryBlock branchDests = mem.getBlock("bdest");
These lines get references to memory blocks we’ll be using.
Make sure the bdest memory is big enough:
if(bdest.getSize() < rom.getSize())
    throw new AddressOutOfBoundsException("The bdest memory can't be smaller than the rom memory.");
Initialize the task monitor. We set the maximum progress equal to the size of rom, as we’ll be iterating over the rom memory. It isn’t necessary to use the TaskMonitor, but it provides a more user-friendly interface.
monitor.initialize(rom.getSize());
Create a stack to keep track of addresses of [ and ] and iterate over the rom. Each iteration we update the monitor and get the current instruction byte. If it is an [, we push the current address on the stack. If an ] is encountered. The address of the corresponding [ is popped from the stack. The branch destination of the ] is set to the address of the [. The branch destination of the [ is set to the address of the instruction following the ]. (It should jump over, but not to, the ].)
Stack<Long> addrStack = new Stack<Long>();
for(long addr = 0; addr < rom.getSize(); addr++){
    monitor.checkCanceled();
    monitor.incrementProgress(1);

    byte instr = readInstruction(rom, addr);
    switch(instr){
        case OPEN_LOOP:
            addrStack.push(addr);
            break;

        case CLOSE_LOOP:
            if(addrStack.empty())
                throw new UnmatchedBranchException(addr);

            long openInstr = addrStack.pop();
            writeBranchDest(bdest, addr, openInstr);
            writeBranchDest(bdest, openInstr, addr + 1);
            break;
    }
}

if(!addrStack.empty())
    throw new UnmatchedBranchException();
If a branch is unmatched (has no corresponding [ or ]), a custom exception called UnmatchedBranchException is raised.
UnbalancedLoopException.java:
package brainfuck;

public class UnmatchedBranchException extends RuntimeException {
    public UnmatchedBranchException() {
        super();
    }

    public UnmatchedBranchException(long address){
        super("Unmatched branch at address 0x" + Long.toHexString(address));
    }
}
The rest of the source code can be found here.
Once this is implemented, writing semantics for the control flow instructions is very easy. The [ checks the current cell value. If it is non-zero, execution should continue at the next instruction and this instruction is essentially a NOP. If the cell is zero, a branch should be performed. The address is retrieved from bdest.
:[ is op=0x6 {
    local c:2 = *[ram]ptr;

    if(c != 0x0) goto <end>;
    local idx:2 = inst_start;
    local dest:2 = *[bdest]idx;
    goto [dest];

    <end>
}
The semantics for ] are even easier. It just branches to the corresponding [:
:] is op=0x7 {
    local idx:2 = inst_start;
    local dest:2 = *[bdest]idx;
    goto [dest];
}
We could have also implemented semantics for ] to check the current cell value and perform a branch accordingly. The current implementation is functionally equivalent to that, is shorter and follows the construction that is commonly used in binaries emitted by compilers (arrows represent branch destinations):
┏━━━> compare
┃ ┌─< conditional branch
┃ │   code (condition false)
┗━│━< unconditional branch to compare
  └─> code (condition true)
The produced flow control graph for the brainfuck binary after running the Brainfuck Branch Destination Resolver analyzer is now identical to the graph produced for the ARM binary:

It also produces a reasonable decompilation (c0 is cell zero):
void start(void){
    while (c0 != 0)
        c0--;

    c0 = 1;

    halt_baddata();
}
The decompiler recognizes the redundancy of +- and it does not show up in the decompilation.
That’s it! The decompiler is now able to decompile any compiled brainfuck binary. Call bfc.py on your favorite brainfuck program and see what the decompilation looks like in Ghidra. One thing that will massively clean up the decompilation is recognizing common patterns. Right now [-] is decompiled to while(c!=0) c--;, while it could theoretically also be decompiled to the more concise c=0;. This is something we’ll take a look at in a future post.
Next time, we’ll make some small improvements to our processor module. See you then!
You can find the final code for this post here.