Debugging Ghidra and its decompiler
Recently, I came across an oddity in the Ghidra decompiler that I wanted to debug. The decompiler is a native C++ application that runs separate from Ghidra itself (the Java application). Whenever Ghidra needs to decompile a function, display a function graph, etc., Ghidra launches the decompiler and delegates that task to it.
Debugging the decompiler when it’s running standalone is as simple as running gdb path_to_repo/Ghidra/Features/Decompiler/build/os/linux64/decompile.
In my case, however, I wanted to debug the decompiler when it’s instantiated by Ghidra.
It’s not so straightforward to just attach a debugger to a running decompiler process, since it would require you to launch the debugger at the same time as the decompiler is launched.
If you write a script that waits until a decompiler process is created and then attaches to it, you’ll likely run into timing issues.
In this post, I’ll explain how to properly debug Ghidra’s decompiler. Since it’s easy to debug Ghidra itself using the development environment we’ll have to set up for the decompiler, I’ll cover that too. The commands and code in this post should work for a Debian-based distro, but the same can be achieved on any (not-too-exotic) operating system.
NB: there’s already some basic functionality built into Ghidra that allows for inspecting the global state of the decompiler, but it’s not (intended to be) a full-fledged debugger.
Setting things up
The Developer’s Guide that comes with Ghidra explains how to set up a Ghidra development environment. A short summary is given here, but be sure to read the official guide if you want to customize the installation.
First, install some basic prerequisites:
sudo apt update && sudo apt upgrade -y
sudo apt install -y build-essential git wget unzip
sudo apt install -y default-jre default-jdk
Install Gradle, if it’s not already on your system:
wget -P /tmp/ https://services.gradle.org/distributions/gradle-6.8.3-bin.zip
unzip -d /opt/gradle /tmp/gradle-6.8.3-bin.zip
Add Gradle to PATH by appending the following code to ~/.bashrc:
export GRADLE_HOME=/opt/gradle/gradle-6.8.3
export PATH=$GRADLE_HOME/bin:$PATH
Run source ~/.bashrc to apply these changes.
Build Ghidra and set up the development environment (this may take some time, so relax and grab a cup of coffee in the meantime):
git clone https://github.com/NationalSecurityAgency/ghidra.git
gradle --init-script gradle/support/fetchDependencies.gradle init
gradle buildGhidra
gradle prepDev
gradle eclipse
You’ll also probably want to install Eclipse to run and debug Ghidra. Eclipse can be downloaded here.
Debugging Ghidra
If you’ve followed the steps above or the Developer’s Guide, debugging Ghidra will be a breeze. First, we’ll open the Ghidra project in Eclipse:
- In Eclipse, click
File → Import.... - Select
General → Existing Projects into Workspace. - Choose the Ghidra repository as root directory.
- Mark
Search for nested projectsand clickSelect all. - Click
Finish.
To debug Ghidra for the first time, go to Debug → Debug configurations... in the menu bar, select Java Application → Ghidra and hit Debug.
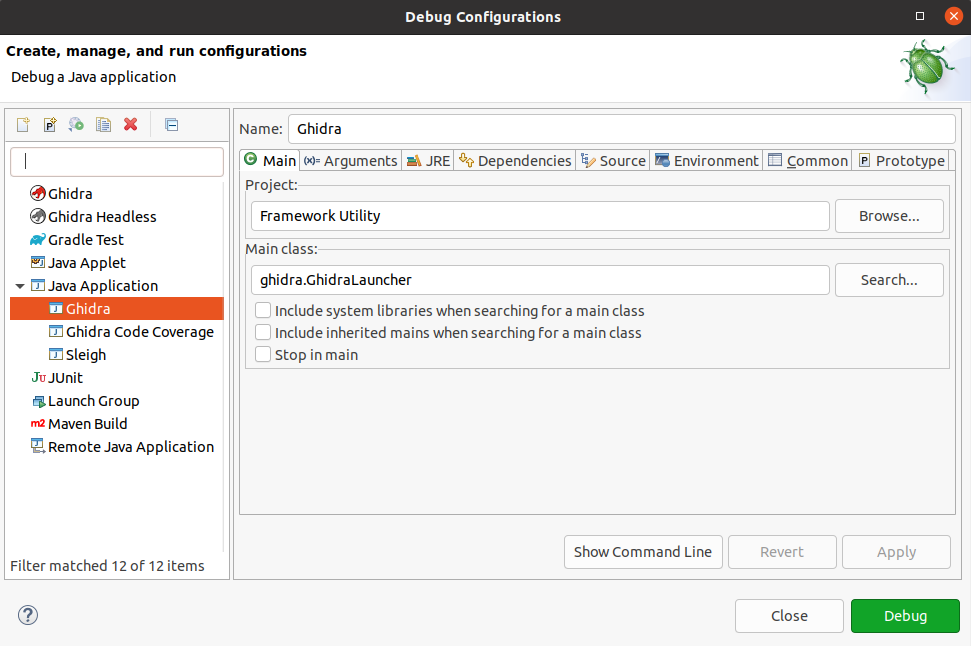
The next time you want to debug Ghidra, you can just press the debug button in the toolbar.
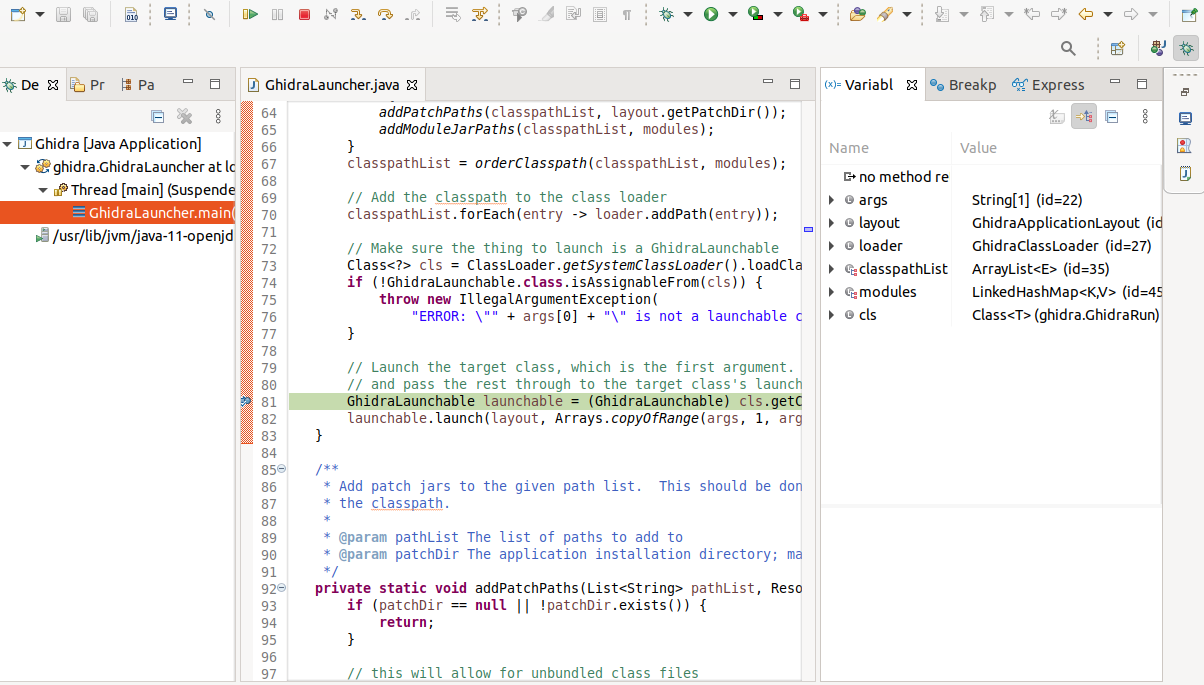
Eclipse now allows you to set breakpoints, step through code, inspect and modify variables etc. for the Ghidra application.
Debugging the decompiler
The approach to debug the decompiler is as follows:
- We’ll add a boolean
debugger_presentto the decompiler, which is initiallyfalse. - Before executing the rest of the program, the decompiler will loop until
debugger_presentistrue. - The debugger attaches to the running decompiler process, sets
debugger_presenttotrueand optionally configures some breakpoints. After that, the normal execution flow continues.
We add the following code to Ghidra/Features/Decompiler/src/decompile/cpp/ghidra_process.cc1:
#include <thread>
#include <chrono>

volatile bool debugger_present = false;
void wait_for_debugger() {
    while (!debugger_present)
        std::this_thread::sleep_for(std::chrono::milliseconds(500));
}
In this same file, insert a call to wait_for_debugger in the main function, which is the entry point of the decompiler:
int main(int argc,char **argv)

{
  wait_for_debugger();
  ...
}
We also need to build the decompiler with debug flags and no optimization flags.
This can be done by commenting/uncommenting the appropriate lines for your compiler in Ghidra/Features/Decompiler/build.gradle#L537-L568.
In my case (gcc) I had to change lines 537-538 from
b.cppCompiler.args "-O2"    // for DEBUG, comment this line out
//b.cppCompiler.args "-g"   // for DEBUG, uncomment this line
to
//b.cppCompiler.args "-O2"  // for DEBUG, comment this line out
b.cppCompiler.args "-g"     // for DEBUG, uncomment this line
Now we need to recompile the project. Since we’ve only modified the decompiler code, only this part of the project will be rebuilt.
gradle buildGhidra
To test this approach, open an arbitrary executable in Ghidra and try to decompile any function.
The decompiler should now hang forever because it’s waiting for debugger_present to be true!

We use pgrep to find the decompiler process and attach to it using gdb:
pgrep -fn decomp
4367

sudo gdb -q path_to_repo/Ghidra/Features/Decompiler/build/os/linux64/decompile 4367
Reading symbols from path_to_repo/Ghidra/Features/Decompiler/build/os/linux64/decompile...
Attaching to program: path_to_repo/Ghidra/Features/Decompiler/build/os/linux64/decompile, process 4367
...
(gdb) set debugger_present = 1
Even after setting debugger_present to true, gdb keeps halting the program until we enter c or continue.
Before doing that, we’ll set a breakpoint at GhidraDecompCapability::initialize:
(gdb) b GhidraDecompCapability::initialize
Breakpoint 1 at 0x55b6d48e5f56: file path_to_repo/Ghidra/Features/Decompiler/src/decompile/cpp/ghidra_process.cc, line 499.
If we type c to continue the program, it’ll hit the breakpoint we’ve just set.
We can now inspect and modify memory and then resume the program:
(gdb) c
Continuing.

Breakpoint 1, GhidraDecompCapability::initialize (this=0x558714894618 <std::vector<PrintLanguageCapability*, std::allocator<PrintLanguageCapability*> >::push_back(PrintLanguageCapability*&&)+50>)
    at path_to_repo/Ghidra/Features/Decompiler/src/decompile/cpp/ghidra_process.cc:499
(gdb) p commandmap
$1 = std::map with 0 elements
(gdb) c
Continuing.
The decompile window in Ghidra should now show the decompilation results.
We can automate this process using two scripts that we’ll call gdb_init and debug.sh.
gdb_init is a gdb command file we’ll pass to gdb using the -x flag.
It contains the commands to be run after attaching to the decompiler.
gdb_init:
set debugger_present = 1

b GhidraDecompCapability::initialize

# uncomment the next line if you want to automatically continue the program
#c
debug.sh looks for the decompiler process and (if found) attaches to it.
It passes the gdb_init command file to gdb.
debug.sh:
#!/bin/bash

decompiler_path=path_to_repo/Ghidra/Features/Decompiler/build/os/linux64/decompile

pid=$(pgrep -fn "$decompiler_path")
if [ -z $pid ]
then
    echo "No decompiler process found"
    exit 1
fi

echo "Attaching to decompiler process with pid $pid"
gdb -q -x gdb_init "$decompiler_path" $pid
This script can be invoked using sudo ./debug.sh.
Pro-tip: if you want to debug the decompiler, it’s a good idea to read the decompiler documentation.
This documentation isn’t built by default, but you can build it by installing doxygen and running make doc in Ghidra/Features/Decompiler/src/decompile/cpp.
The documentation will be written to Ghidra/Features/Decompiler/src/decompile/doc.
Conclusion
In this post we’ve looked at one possible way of debugging a decompiler process created by Ghidra.
I’m sure there are many other ways to do this, but – after modifying the source code – this method is easy and works reliably.
A possible improvement to this method would be to only wait for debugger_present to be set to true if an environment variable such as GHIDRA_DECOMPILER_DEBUG is set to true.
That way you can conveniently disable the debugging functionality altogether using one simple command.
If you’ve got an alternative method, let me know!
Happy debugging!